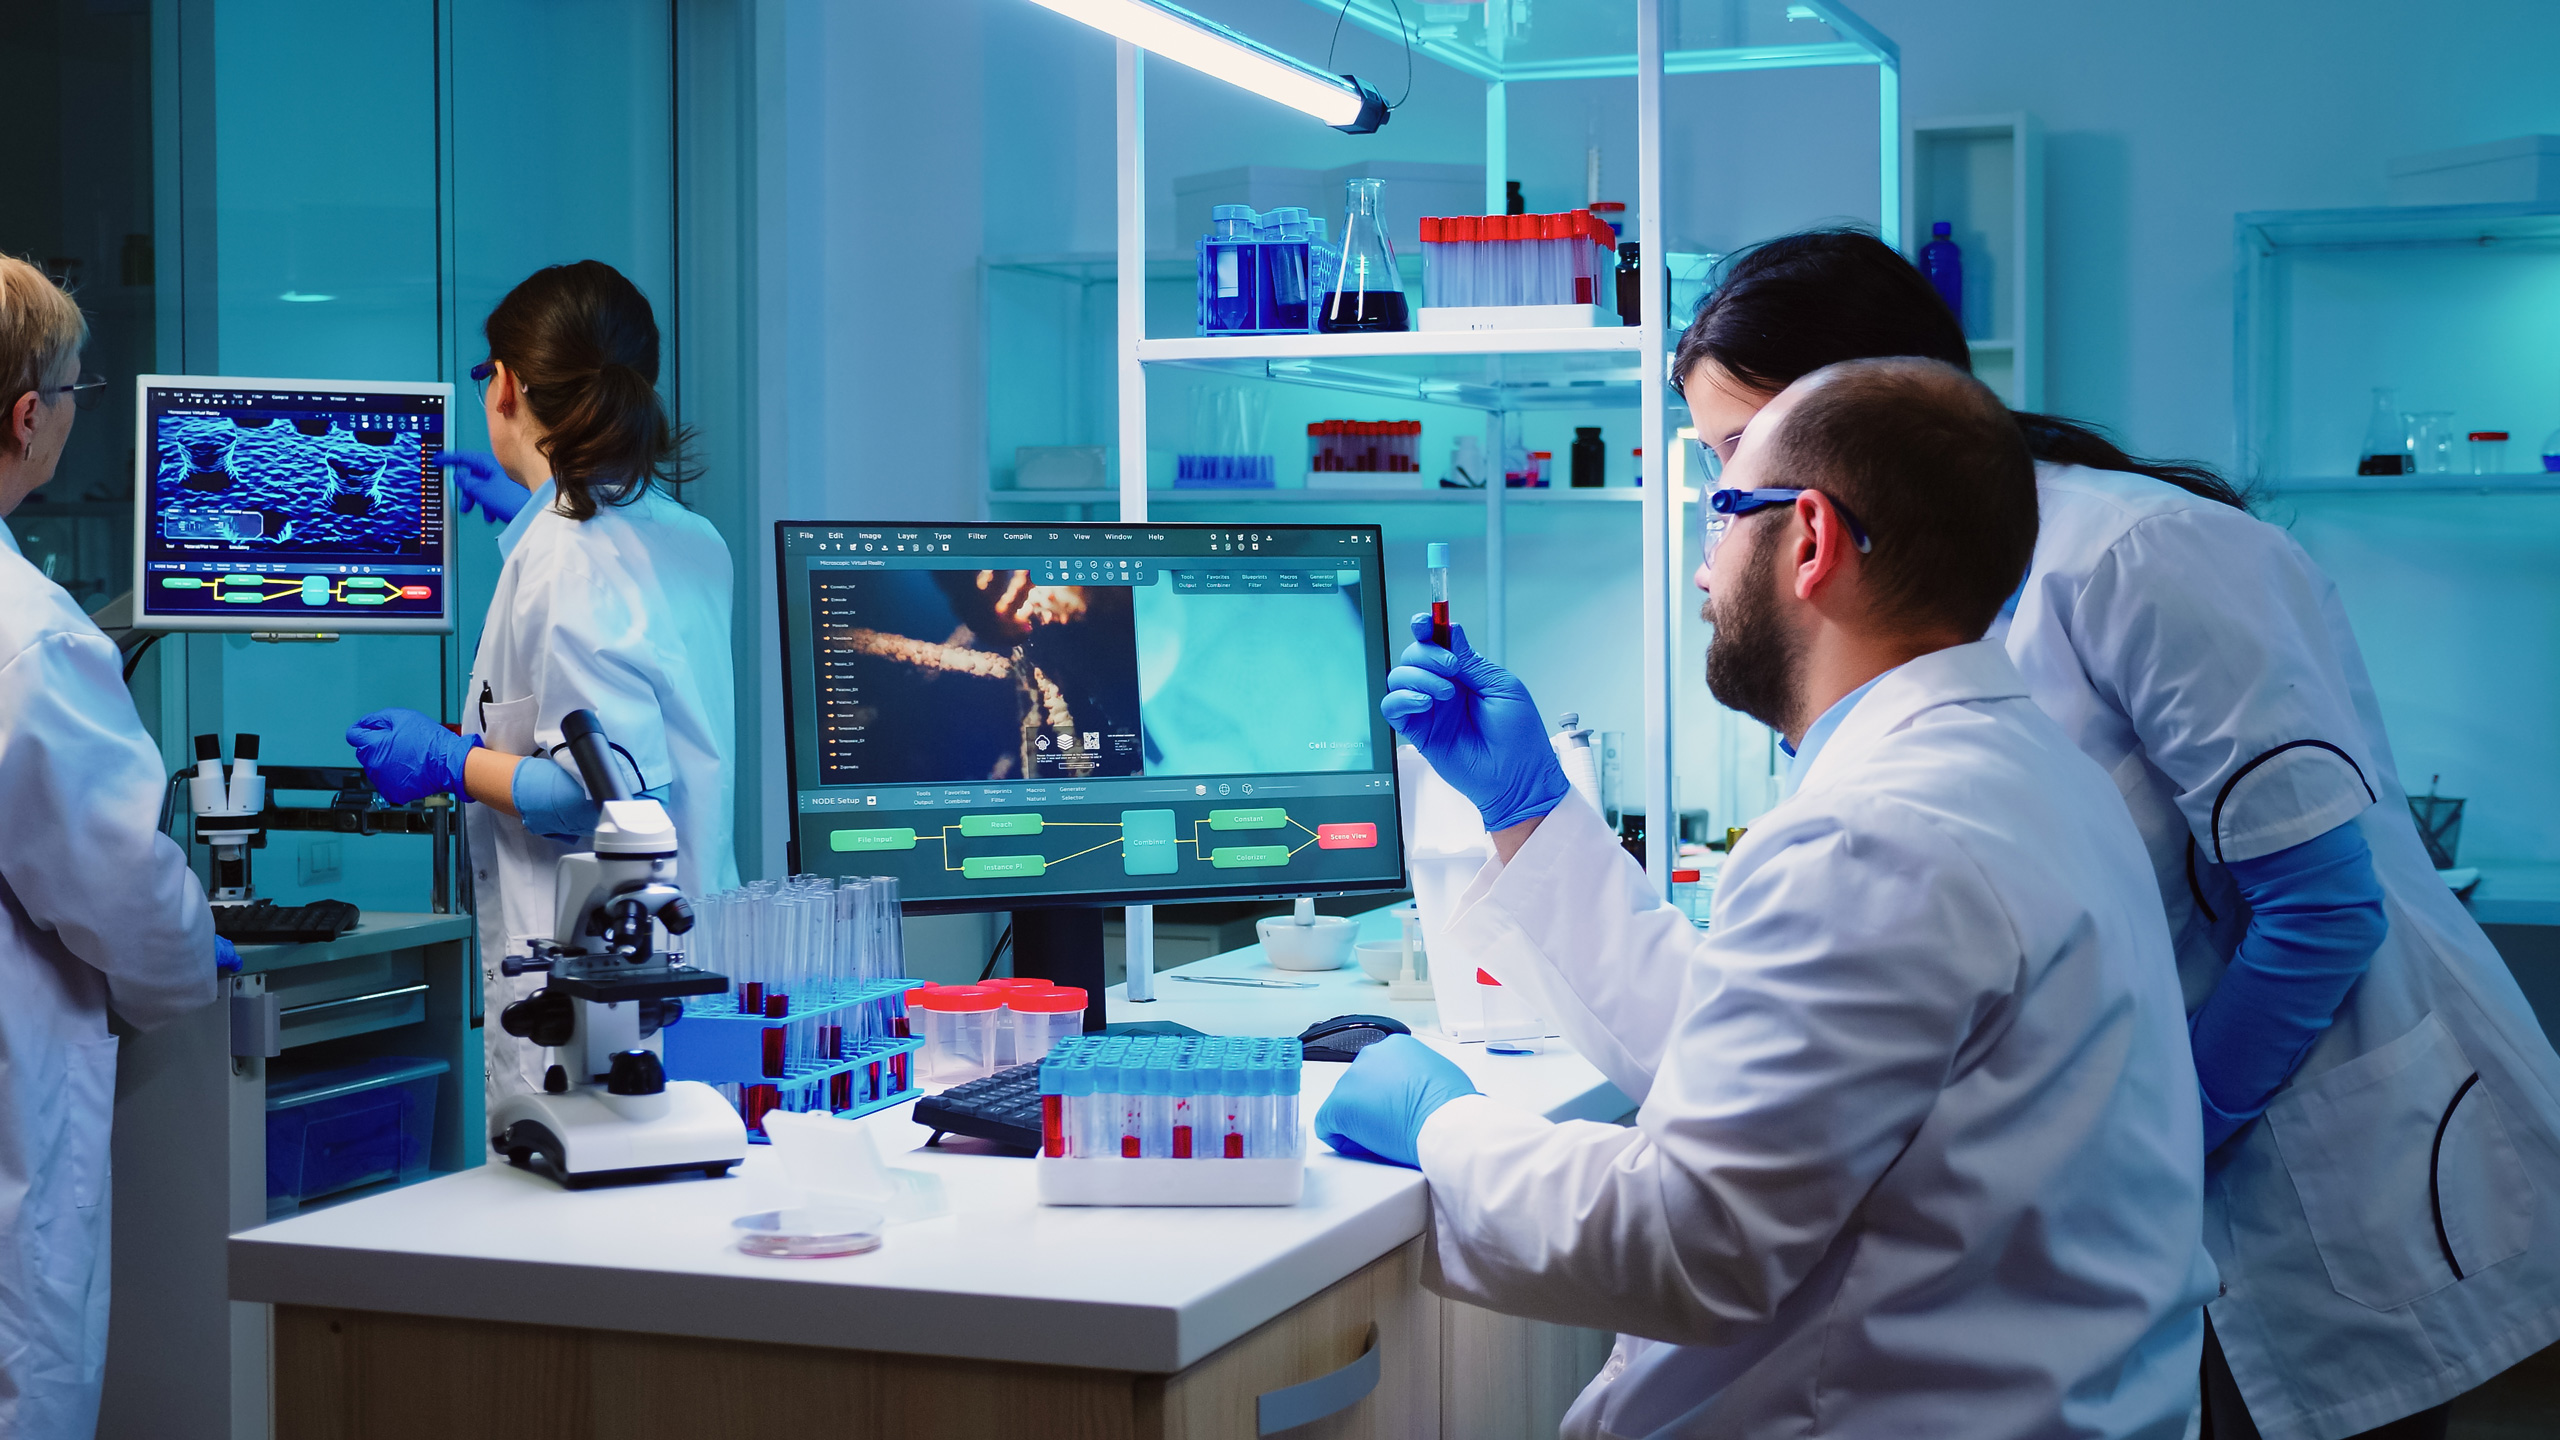
Laboratory Operations Training Courses

Laboratory Analysis

Laboratory Analysis Courses

Laboratory Operations Training Courses

Duration: 1.00 Hrs

Course Level: Intermediate
Languages: English
Capability: Audio, Video, MobileReady

This course describes the major tasks associated with performing analytical procedures in a chemical lab. It discusses qualitative and quantitative analyses, accuracy and precision, validation of procedures, and the use of standards. It describes the following basic steps for performing an analysis: handling samples; choosing and performing appropriate analytical procedures; and collecting and reporting data, including calculating percent recovery and relative percent difference.

Learning Objectives

By the end of this course, you will be able to:

  • Define the following terms: analyte, qualitative analysis, quantitative analysis, accuracy, precision, validation, primary standard, and secondary standard.
  • Describe the general purpose of an analysis and identify two basic types of analyses.
  • List three major steps for performing a typical analysis.
  • List factors that can compromise sample integrity.
  • Define the following terms: representative sample, selective sample, and reagent.
  • Identify tasks associated with collecting and receiving samples.
  • Identify tasks associated with preparing and storing samples.
  • Describe factors involved in determining whether an analytical procedure is appropriate for a given analysis.
  • Define the following terms: specific procedure, selective procedure, and limit of detection.
  • Describe general tasks that are typically part of the preparation, performance, and completion of an analytical procedure.
  • Define the following terms: primary data, raw data, secondary data, confidence limits, confidence interval, and confidence level.
  • Identify ways that data can be collected during an analysis.
  • Describe calculations that may be required to convert raw data into final, reportable data.
  • Explain how statistics can be used to interpret information that is collected during an analysis.
  • Describe considerations associated with managing information collected during an analysis.

Duration: 1.00 Hrs

Course Level: Intermediate
Languages: English
Capability: Audio, Video, MobileReady

This course explains how sample components can be separated by gas chromatography. It discusses the basic principles of the gas chromatography process and describes the major parts of a typical gas chromatography system, including an auto sampler, packed columns, capillary columns, a flame ionization detector (FID), and a data system. It describes the major steps of a chromatographic analysis, including sample preparation and injection, sample separation, component detection, and data processing. It also discusses the basic features of a typical gas chromatogram and describes how the information presented on a gas chromatogram is used for qualitative and quantitative analysis.

Learning Objectives

By the end of this course, you will be able to:

  • Define the following terms: “chromatograph,” “chromatogram,” “mobile phase,” “carrier gas,” “stationary phase,” “gas-liquid chromatography,” and “gas-solid chromatography.”
  • State the three main goals of gas chromatography in most cases.
  • Explain how components are separated and analyzed by gas chromatography.
  • Describe the function and features of a typical carrier gas supply.
  • Describe one way to prepare a liquid sample for injection.
  • Describe the basic operation of an auto sampler.
  • Describe the function and features of a typical injector for a gas chromatograph.
  • Define the following terms: “resolution,” “HETP,” “sample capacity,” “packed column,” “capillary column,” “selectivity,” “retention time,” “tailing,” “isothermal operation,” and “temperature programming.”
  • Describe the function and features of the column and the oven for a typical gas chromatograph.
  • Describe the following types of chromatography columns: FSOT, WCOT, PLOT, and SCOT.
  • Define the following terms: “sensitivity,” “minimum detectable level (MDL),” and “peak integration.”
  • Describe the basic features and operation of a flame ionization detector.
    State the functions that are typically performed by a microprocessor-controlled data system.
  • Identify the basic features of a typical chromatogram and describe how the information on a chromatogram is used for qualitative and quantitative analyses.
  • Describe the ideal appearance of a chromatographic baseline and identify common types of baseline abnormalities.
  • Describe the ideal appearance of a peak on a chromatogram and identify common peak shape abnormalities.

Duration: 1.00 Hrs

Course Level: Intermediate
Languages: English
Capability: Audio, Video, MobileReady

The purpose of this course is to present a fundamental treatment of how to perform infrared (IR) analysis. The course starts by describing the basic concepts underlying IR, and then describes several methods used to prepare samples for analysis. After the major components of a typical IR spectrometer are identified, a demonstration of how to perform IR analysis is presented. The course concludes by introducing the graph used to show the results of an analysis, describing the characteristics of a typical IR spectrum, and identifying different ways IR results can be used in chemical plants.

Learning Objectives

By the end of this course, you will be able to:

  • Describe how molecules can vibrate.
  • Describe how a sample’s molecules interact with IR radiation.
  • Describe sample cells that can be used for IR analyses.
  • Describe considerations associated with selecting solvents for IR analyses.
  • Describe how to prepare a liquid sample using the thin film method.
  • Describe how to prepare a liquid sample using the attenuated total reflectance (ATR) method.
  • Describe how to prepare a solid sample using the solution method, the mull method, and the pellet method.
  • Describe general considerations associated with sample preparation.
  • Identify two types of spectrometers used to perform IR analysis.
  • Describe the major components of a typical IR spectrometer.
  • Describe the main difference between the operation of dispersive spectrometers and the operation of Fourier transform infrared (FT-IR) spectrometers.
  • Describe how to operate a typical IR spectrometer.
  • Describe the graph that shows the results of an IR analysis.
  • Describe the spectrum used to represent the response of a sample to IR radiation.
  • Describe in general terms how the results of an IR analysis can be used.

Duration: 1.00 Hrs

Course Level: Intermediate
Languages: English
Capability: Audio, Video, MobileReady

This course introduces participants to the basic principles associated with ions as well as laboratory procedures that depend on the presence of ions. The course includes an explanation of how ions are formed and how they can be represented. In addition, the course describes how a pH meter can be used to measure the acidity or alkalinity of a liquid and how a conductance meter can be used to measure a liquid’s ability to conduct current. The course also includes an explanation of the process of ion exchange chromatography.

Learning Objectives

By the end of this course, you will be able to:

  • Define the following terms: “ion,” “net charge,” “cation,” “monatomic cation,” “polyatomic cation,” “anion,” “monatomic anion,” and “polyatomic anion.”
  • Describe various ways in which different types of ions can be represented.
  • Define the following terms: “acid,” “base,” “neutral,” and “pH.”
  • Describe the difference between a strong acid and a weak acid and the difference between a strong base and a weak base.
  • Describe a typical pH meter and explain how it can be used to measure the concentration of hydrogen ions in a sample.
  • Define the following terms: “conductance,” “electrolyte,” “conductance,” “chromatography,” and “ion exchange chromatography.”
  • Describe how current can flow through a solution.
  • Explain how conductance measurements can be obtained from a sample in a lab.
  • Describe the process of ion exchange chromatography.

Duration: 1.00 Hrs

Course Level: Intermediate
Languages: English
Capability: Audio, Video, MobileReady

This course demonstrates some math fundamentals necessary to perform various calculations in the lab. The metric (SI) measurement system is described and practical instruction is given on the conversion to English units and vice versa. Exponential numbers are explained, and participants are shown how to perform arithmetic operations with them. Also, the rules for significant figures and rounding are described. Converting between fractions, decimals, and percents is demonstrated; and finally, ratios and proportions are explained and examples of their practical use are shown.

Learning Objectives

By the end of this course, you will be able to:

  • Describe units of measurement in the English system and in the metric/SI system.
  • Describe how conversions can be made between various units of measurement.
  • Describe rules for writing exponential numbers.
    Explain how to multiply, divide, add, and subtract exponential numbers.
  • Describe rules for significant figures.
  • Describe how to report the results of calculations to the correct number of significant figures.
  • Describe rules for rounding numbers.
  • Explain how to convert between fractions, decimals, and percents.
  • Explain how to express a ratio between two materials.
  • Explain how to solve a proportion for an unknown value.

Duration: 1.00 Hrs

Course Level: Intermediate
Languages: English
Capability: Audio, Video, MobileReady

This course describes how to perform calculations that are involved in preparing some types of solutions commonly used in labs. Specifically, it discusses calculations required for preparing dilutions, mass percent solutions, volume percent solutions, molar solutions, and normal solutions.

Learning Objectives

By the end of this course, you will be able to:

  • Define the following terms: “solute,” “solvent,” and “solution.”
  • Describe calculations associated with determining a dilution factor and using a dilution factor to prepare a diluted solution.
  • List three types of solutions commonly used in labs.
  • Describe calculations for preparing a mass percent solution.
  • Describe calculations for preparing a volume percent solution.
  • Describe calculations for converting between mass percent and volume percent.
  • Define the following terms: “formula mass,” “molecular mass,” “gram-molecular mass,” “empirical formula,” “mole,” “molarity,” and “formality.”
  • Describe calculations for preparing a molar solution.
  • Describe how formality can be used in lab work.
  • Define the following terms: “equivalent mass,” “gram-equivalent mass,” “normality,” and “molality.”
  • Describe calculations for preparing a normal solution.
  • Describe how molality can be used in lab work.
  • Describe how tables can be used for preparing standard solutions.

Duration: 1.00 Hrs

Course Level: Intermediate
Languages: English
Capability: Audio, Video, MobileReady

This course introduces basic concepts of statistics and statistical analysis that can be applied to lab work. It defines terms associated with basic statistical concepts and explains how statistical process control (SPC) can be used in labs. It explains how control charts (focusing on an individual X chart) can be used to monitor the performance of analytical systems and interpret the results of analyses.

Learning Objectives

By the end of this course, you will be able to:

  • Define the following terms: “accuracy,” “precision,” “data point,” “data set,” “mean,” “variance,” and “standard deviation.”
  • Identify three key factors that affect confidence in the reliability of an analytical measurement.
  • Describe the two types of variations that affect the reliability of analytical data.
  • Explain how to calculate variance and standard deviation.
  • Describe how assumptions affect the validity of answers that are based on math operations associated with statistics.
  • Describe the fundamental differences between applying SPC to production processes and applying SPC to lab work.
  • Define the following terms: “confidence limits,” “confidence interval,” and “confidence level.” Control Charts, Part 1
  • Identify the basic features of a typical control chart and explain how a normal distribution curve and a control chart are related.
  • Explain how an individual X chart is constructed and plotted.
  • Describe lab technician responsibilities associated with control charts. Control Charts, Part 2
  • Explain how to interpret an individual X chart.
  • Identify some common patterns of instability that may be seen on control charts.
  • Describe, in general terms, how individual X charts are maintained.

Duration: 1.00 Hrs

Course Level: Intermediate
Languages: English
Capability: Audio, Video, MobileReady

This course describes the process of mass spectrometry and the analytical instrument that is used to perform this process. The focus is on a typical bench top gas mass/mass spectrometry (GC/MS) system. The system featured in this course includes a gas chromatograph with a capillary column, directly coupled to a mass spectrometer. The course explains the basic principles of mass spectral analysis, identifies the major parts of a typical GC/MS system, and describes the major steps of sample introduction, ionization (by electron-impact ionization), fragmentation, separation by mass (in a quadruple mass analyzer), detection of ions (by an electron multiplier), and data processing. The basic features of a typical mass spectrum and a typical total ion chromatogram are also described, and the use of the data system for controlling the GC/MS and for data processing, including performing library searches of mass spectra, is discussed.

Learning Objectives

By the end of this course, you will be able to:

  • Define the following terms: “spectrum,” “mass spectrometer,” “mass spectrum,” “abundance,” “relative abundance,” and “base ion.”
  • Describe the basic process of mass spectrometry and explain why it can be used to perform qualitative and quantitative analyses.
  • List the major steps associated with the process of mass spectrometry.
  • Identify the major parts of a typical mass spectrometry system and describe the basic operation of the system.
  • State the separate purposes of gas chromatography and mass spectrometry in a GC/MS system.
  • List a major advantage and three limitations that relate to sample selection for a GC/MS system.
  • Describe a typical sample introduction step for a GC/MS system.
  • Describe the electron ionization process.
  • Describe how fragmentation occurs in a mass spectrometer.
  • Describe how a repeller and focusing optics can direct ions into a mass analyzer.
  • Describe how separation by mass occurs in a quadrupole mass analyzer.
  • Describe the use of an x-ray lens and an electron multiplier for ion collection, detection, and amplification.
  • Explain how the scan mode and the SIM mode enable a mass spectrometer to scan different ranges of ions in a mass spectrum.
  • Describe the data processing and control functions performed by the data system in a GC/MS system.
  • Define the following terms: “molecular ion,” “parent ion,” “isotopes,” and “tuning.”
  • Describe the features of a typical mass spectrum.
  • Describe the features of a total ion chromatogram.
  • Describe lab technician responsibilities associated with a GC/MS system.

Duration: 1.00 Hrs

Course Level: Intermediate
Languages: English
Capability: Audio, Video, MobileReady

In this course, the basic principles and operation of optical analytical instruments are discussed. This course looks at the basic principles, operation, and use of colorimeters, polarimeters, turbidimeters, nephelometers, and refractometers.

Learning Objectives

By the end of this course, you will be able to:

  • Define the following terms: “electromagnetic radiation,” “electromagnetic spectrum,” “frequency,” and “wavelength.”
  • Describe in general terms the relationship between electromagnetic radiation and optical analysis.
  • Identify the parts of a colorimeter.
  • Explain how a colorimeter is used to analyze a sample.
  • Explain how a calibration curve is obtained.
  • Describe the basic principles of polarimetry.
  • Identify the parts of a simple polarimeter.
  • Explain how to set up and use a simple polarimeter.
  • Describe a general procedure for performing an analysis using an automatic polarimeter.
  • Describe the basic principles of turbidimetry and nephelometry.
  • Describe a general procedure for using a turbidimeter to analyze a sample.
  • Describe the basic principles of refractometry.
  • Describe a procedure for using a refractometer.
  • Define the term “refractive index” and identify factors that can affect the refractive index of a sample.

Duration: 1.00 Hrs

Course Level: Intermediate
Languages: English
Capability: Audio, Video, MobileReady

This course is designed to introduce participants to the analytical technique of UV-visible spectroscopy. The course covers the properties of the electromagnetic spectrum and the basic principles of UV-visible spectroscopy as well as terms used to describe this analytical technique. The course also introduces the equipment used to perform UV-Visible spectroscopy and covers the way typical UV-visible spectroscopy analysis can be performed.

Learning Objectives

By the end of this course, you will be able to:

  • Describe the properties of the electromagnetic spectrum.
  • Define the following terms: “spectroscopy,” “amplitude,” “wavelength,” “frequency,” “percent transmission,” “absorbance,” “spectral absorbance curve,” and “band pass.”
  • Describe the process of UV-visible spectroscopy.
  • Describe how quantitative and qualitative analyses can be performed using UV-visible spectroscopy.
  • Describe the components of a UV-visible spectrophotometer.
  • Define the term “chromophore.”
  • Describe considerations associated with samples used in UV-visible spectroscopy.
  • Describe general considerations associated with using UV-visible spectroscopy for a quantitative analysis.
  • Describe how to use a spectrophotometer to perform a quantitative analysis.
  • Describe how to use the results produced by a UV-visible spectroscopy analysis.